Remember about 7 months ago when I had the idea of creating a newsletter to highlight the must-attend tech events here in Chicago? And then, after releasing v1 of the newsletter, all in-person tech events were subsequently canceled for the foreseeable future as a result of a global pandemic? My, how the world has changed…
Since then, I’ve been thinking a lot about what types of content would be useful to the Chicago tech community and beyond. After speaking with many of you, I’ve come to the conclusion the most useful content will come from sharing bits of my thinking and the analysis we’re doing at Chicago Ventures.
Putting on my Tomasz Tunguz hat for this post, I wanted to put some data behind a question many of us have been asking – “How have recent macro events affected early stage financing activity in Chicago?"
To answer this question, I put together a look back at how Seed and Series A financing activity in 2020 compares to activity in the years since 2015. The results will help us understand the volatile world we’re living in and better equip ourselves to operate in the “new normal,” if there is one.
Takeaways
High-Level Takeaway:
Chicago early-stage financing activity in 2020 has decreased compared to last year, but is still largely on par with 2018 and more active than 2015 - 2017.
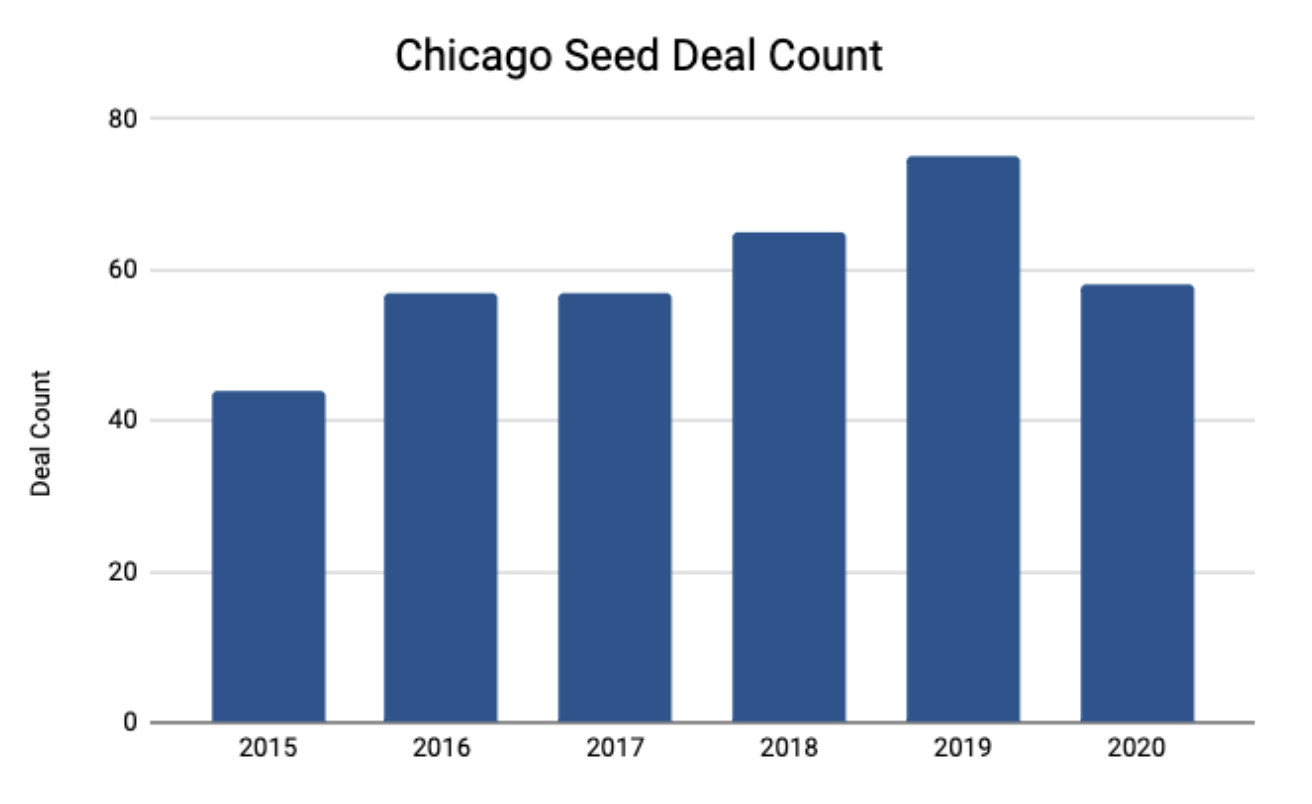
Chicago Seed financing activity through August of each year

Total seed deal count has decreased compared to the same point of the year in 2019 and 2018, but is on par with 2015 - 2017.

However, total seed capital raised so far this year is on par with 2018 and 2019, and greater than 2015 - 2017.
Chicago Series A financing activity through August of each year

Total Series A deal count has decreased when compared to the same point of the year in 2019. However, deal count has decreased only slightly since 2018 and is well above the totals in 2015-2017.

Very similar takeaway for total Series A capital raised.
Based on this data, early-stage activity in Chicago is still alive and well. 2019 was a particularly active year for Seed and Series A financing activity across the board, both in terms of deal count and total capital raised. So far, 2020 certainly hasn't matched this trend. However, financing activity in 2020 is still largely on par with 2018 and above the levels of funding in 2015-2017.
These findings are substantiated by our friends at M25, who recently released their 2020 Best of the Midwest: Startup Cities Rankings. Based on their comparative analysis of startup activity across cities in the Midwest, Chicago remained at the top of the list by a large margin.
Beyond the Data
That said, this data may not tell the whole story.
First, my analysis only answers the question of what's happening to financing quantity. It does not answer the question of whether startup quality has changed in recent years. My sense is that many exceptional companies are regularly founded in Chicago. However, the true test will come years down the line when exits start to occur.
Second, It's important to keep in mind that there is latency in funding announcements and Pitchbook’s data isn't perfect. Funding announcements are a lagging indicator. People’s live observations of what’s happening in the market, while oftentimes anecdotal, is much closer to a real-time indicator.
The results of this analysis may change in the coming months as new financings are announced and more data is gathered. I think Tunguz says it best when he wrote:
"I’m reminded of the five blind men and the elephant. Some data sources show the trunk, others the belly, and others the tail. In a few quarters, we’ll understand the true nature of market perturbations triggered by COVID. But today, we’re still sketching out the nature of the beast."
Methodology
I used broad definitions for Seed ($500k - $5M) and Series A ($5M - $15M) to evaluate financing activity in these two stages. All data is pulled from PitchBook.
I also chose to use data on financing activity through August of each year as opposed to data for the entire year. Given startup financing activity changes at different points throughout the year, this approach is more of an apples to apples comparison in determining how 2020 compares to prior years.


